
What Broadening Market Performance Means for Investors
The stock market has continued its historic rally with the S&P 500 gaining 19% year-to-date with reinvested dividends, contributing to a total return of 61% since the market bottom in 2022. While much of this performance has been driven by large cap technology stocks over the past 18 months, there are now signs that other parts of the market are benefiting as well. These shifts highlight the important fact that while investing trends may come and go, it’s the tried-and-true principles of investing that help investors grow their portfolios and achieve their financial goals over years and decades. What should investors know about diversifying across sectors and styles over the next several quarters?
Performance is broadening beyond large cap growth
While investors tend to focus on major market indices and the one or two areas driving recent returns, the reality is that performance leadership tends to change over time. Large cap tech stocks have dominated headlines recently and for good reason – the Magnificent Seven stocks have gained 192% over the past year and a half. This is partly due to excitement over artificial intelligence breakthroughs, and partly because lower interest rates are generally positive for growth. This recent performance is also a reversal of the tech crash in 2022 when the Fed hiked rates.
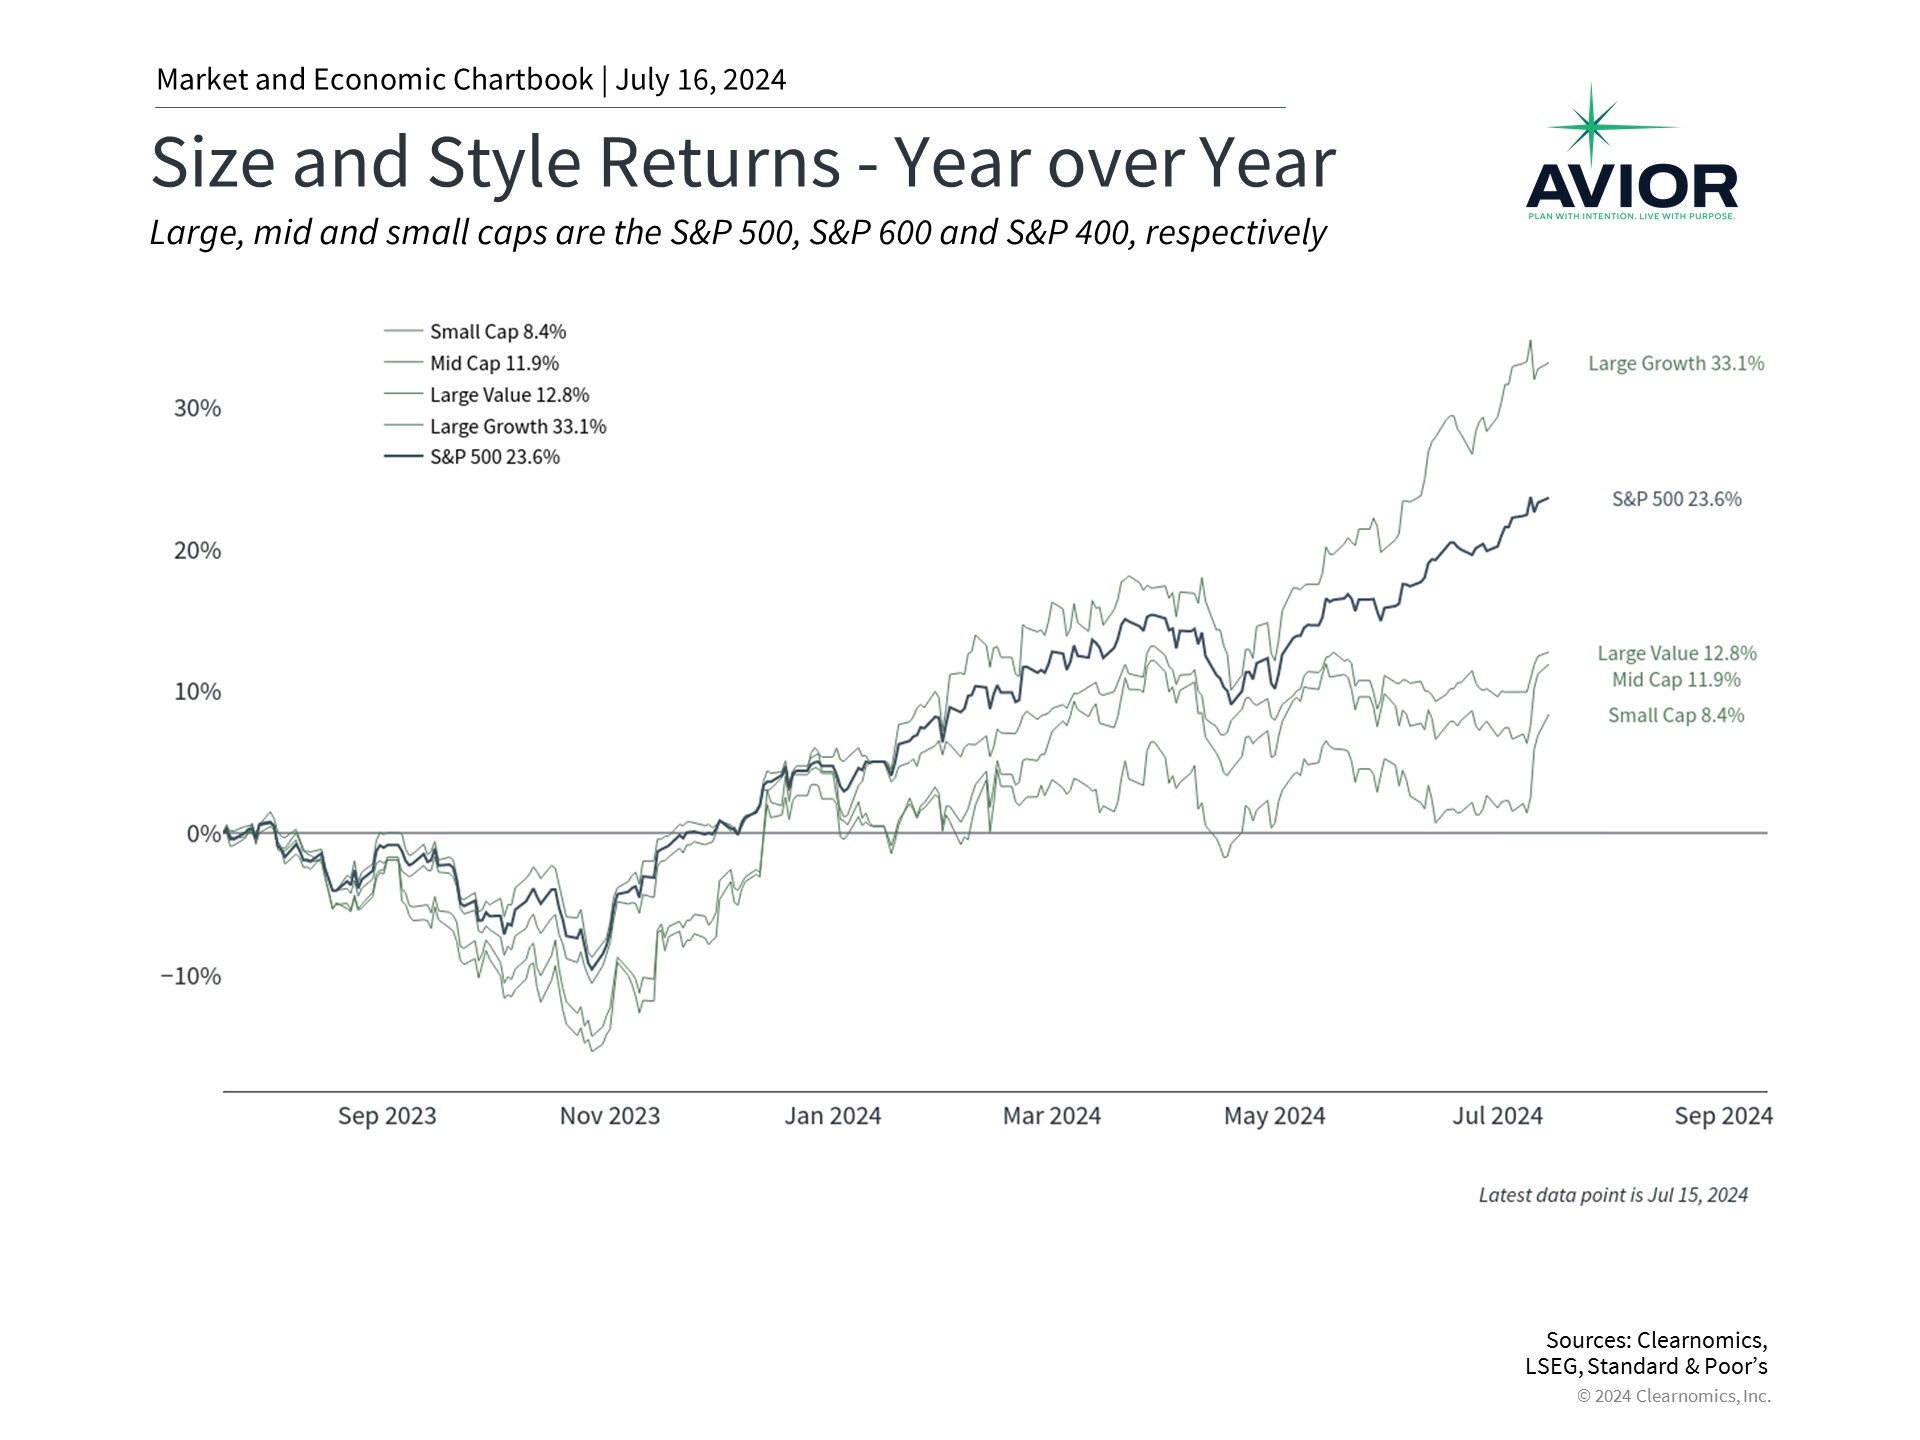
However, as the accompanying chart shows, there are now signs that other areas of the market are beginning to participate, with three important implications for investors.
First, recent economic reports confirm that inflation is improving which could lead the Fed to cut rates once or twice this year. This has propelled areas such as small cap stocks and large cap value. Small caps in particular tend to be more sensitive to interest rates since they represent less mature companies that often have more limited access to capital. Thus, the prospect of lower rates can be a catalyst for many of these stocks. These companies also tend to be more U.S.-focused, so they often outperform when there is positive news on economic growth.
Growth and value can each outperform over long periods
Second, value stocks have performed better recently due to these same factors. Notably, this has not been at the expense of growth stocks, per se. Instead, value stocks may be in the early stages of catching up after lagging for the past 18 months.
What exactly are value and growth stocks? While their exact definitions can differ among investors, these factors tend to be characterized by each stock’s valuation level. Those with lower valuations tend to be characterized as “value” while those with higher valuations are classified as “growth.” More broadly, value investors hope that a stock’s share price will adjust based on what it “should” be worth based on fundamentals such as earnings. Growth investors, on the other hand, hope that a company will continue to grow substantially, and are thus less concerned about the current valuation level or share price.
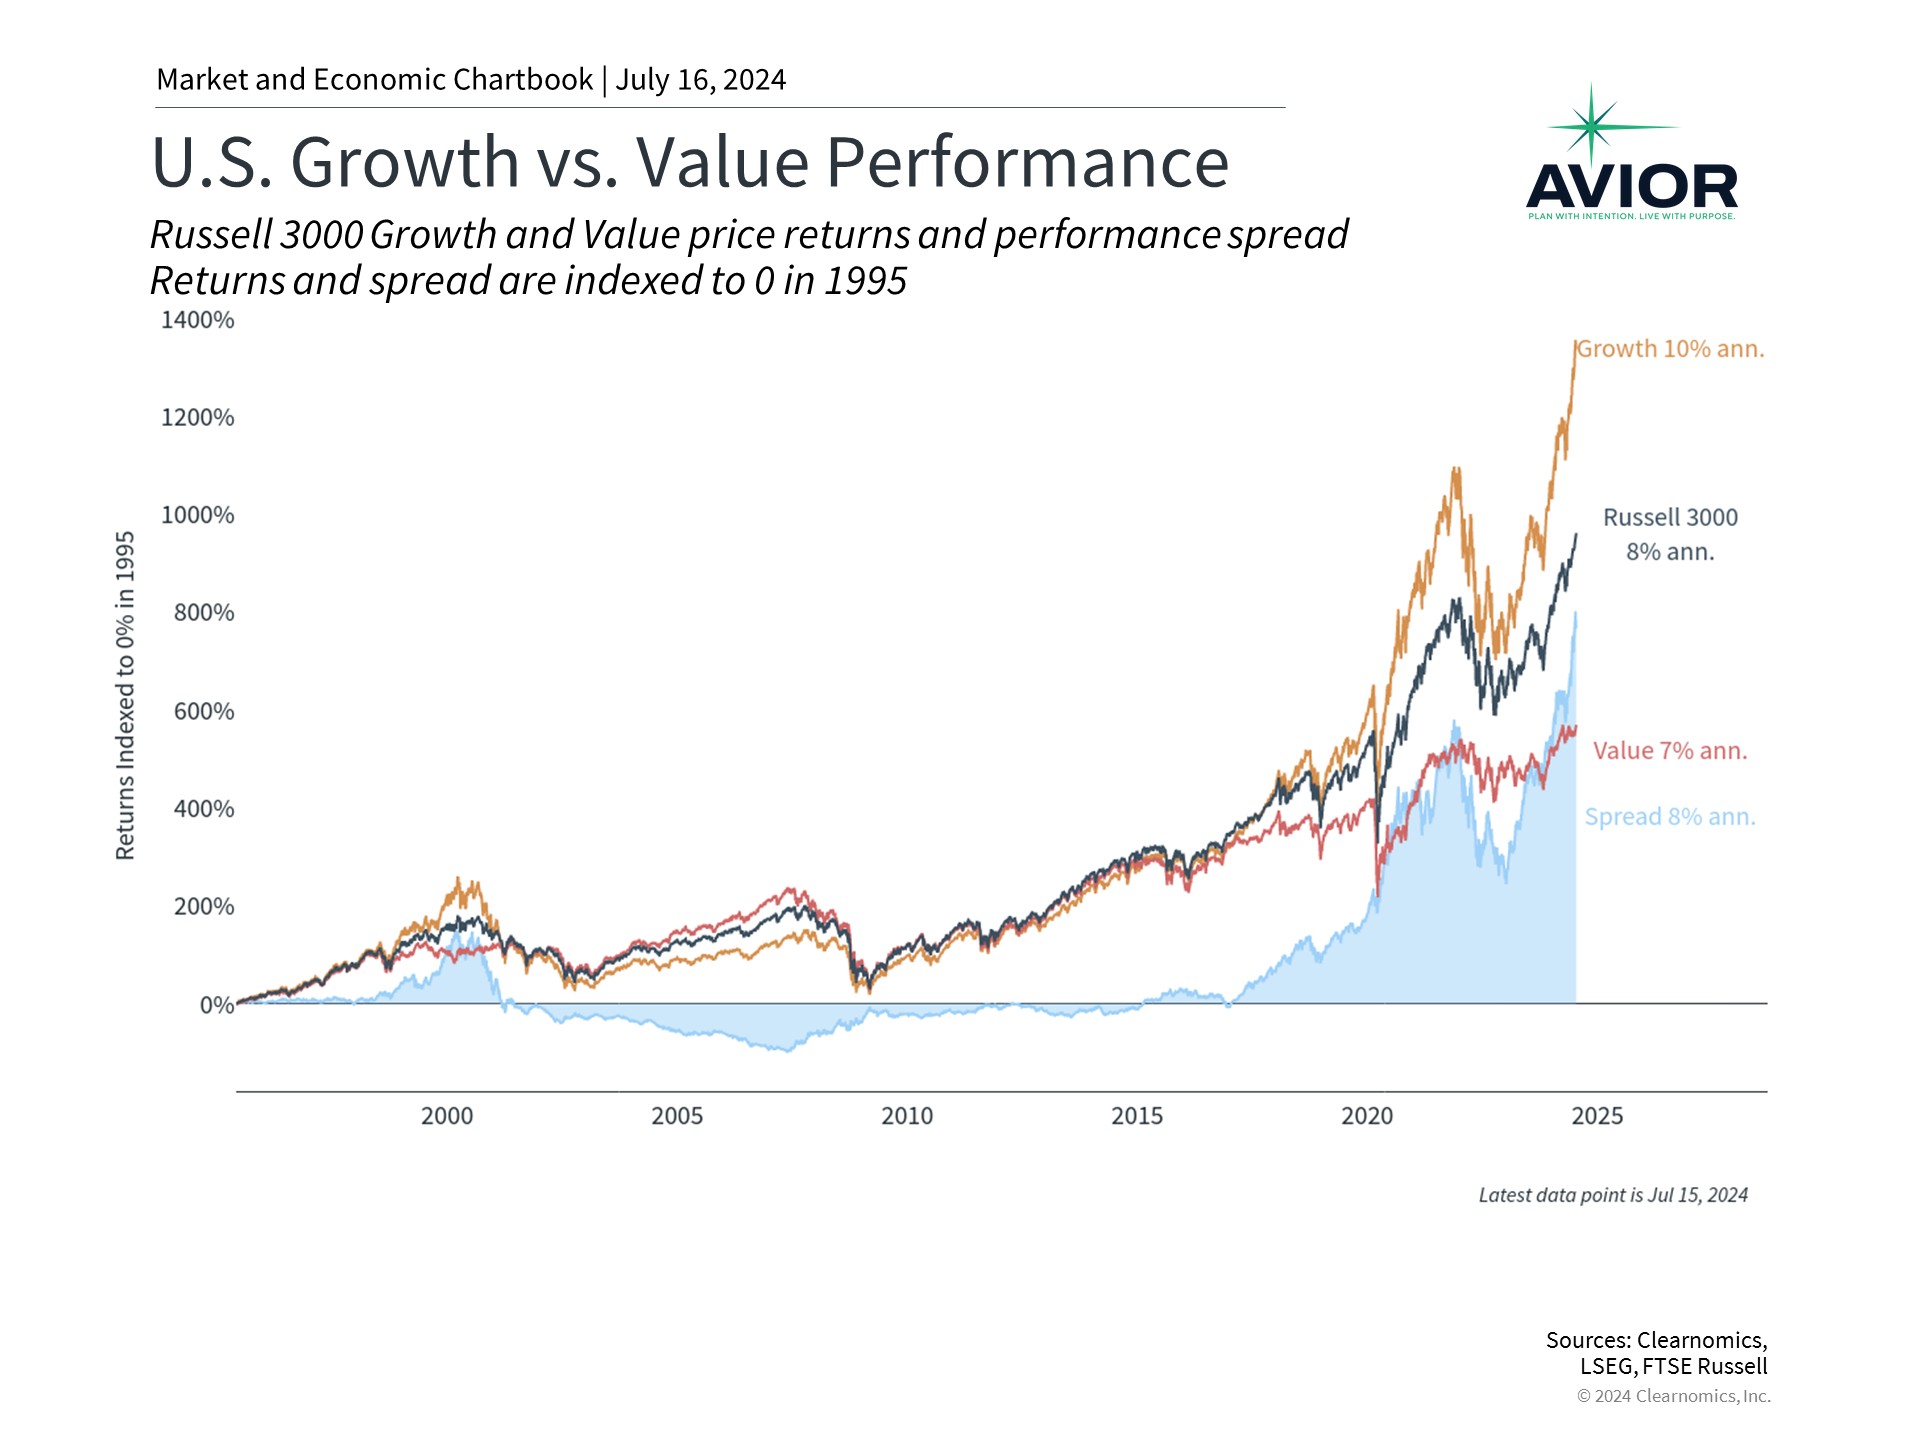
The accompanying chart provides historical perspective on how value and growth have fluctuated over time. In the late 1990s and early 2000s, growth stocks outperformed during the dot-com boom. This then gave way to strong outperformance of value stocks through much of the 2000s. This cyclical rotation from growth to value and back has occurred throughout history, driving much of the academic research around the value premium. So, while growth stocks have strongly outperformed most recently, history shows that leadership changes are not unusual.
Diversifying across styles helps to reduce portfolio risk
Finally, the outperformance of growth stocks does not mean that diversification is no longer relevant. In fact, the opposite is true: diversifying across styles allows investors to benefit from recent market trends while also protecting their portfolios from potential risks.
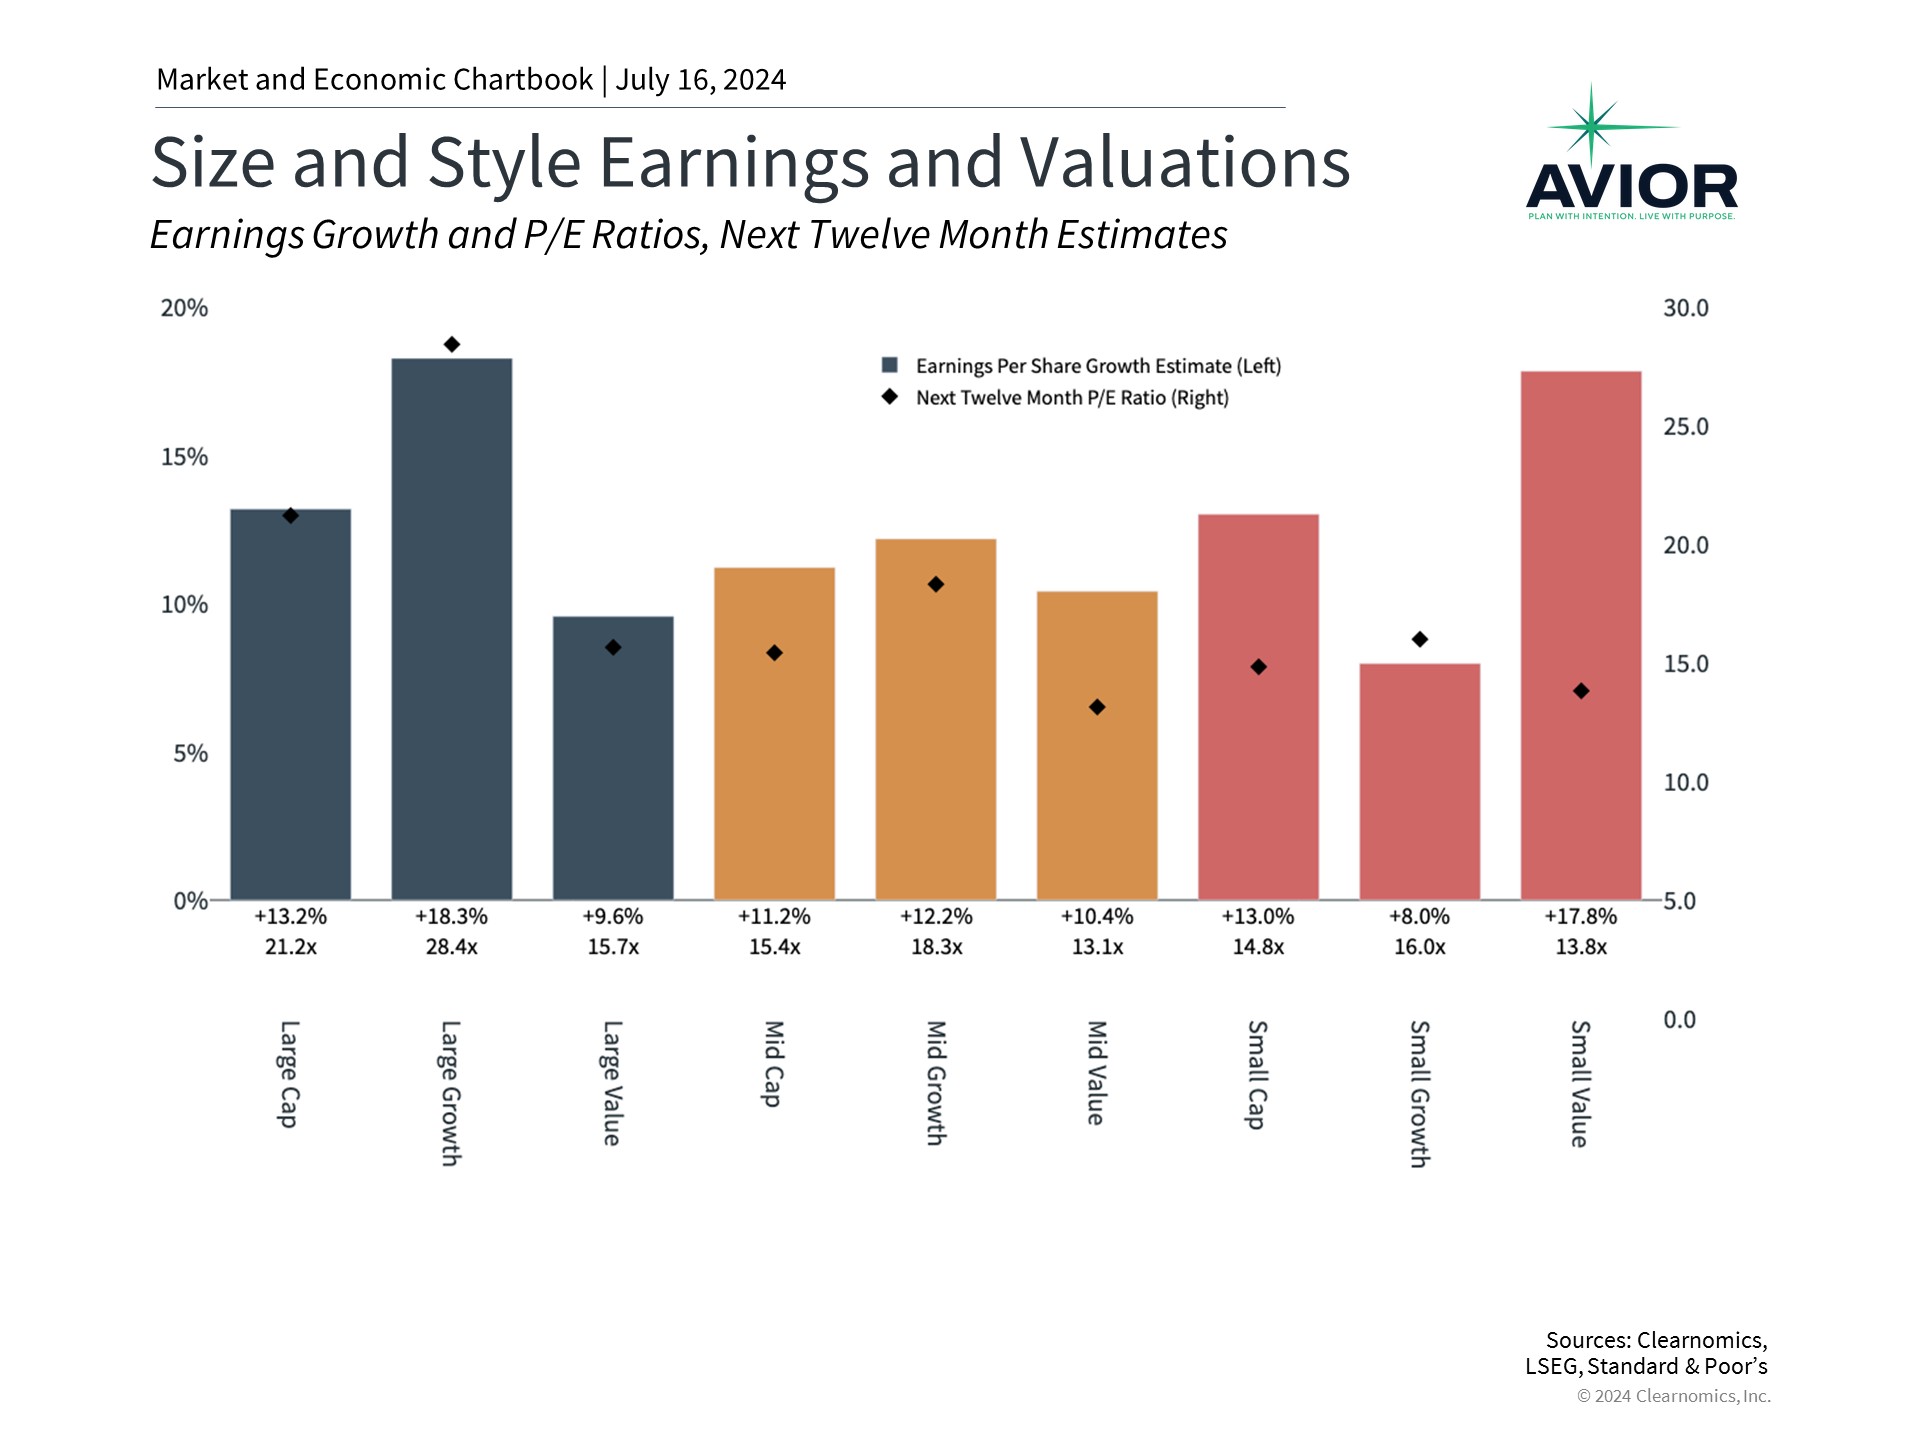
For example, the accompanying chart shows that those parts of the market that have performed well also have excessive valuations. The price-to-earnings ratio of large cap growth is now 28.4, driving the overall S&P 500 index P/E to 21.2. In contrast, large cap value only has a P/E of 15.7 while small cap value is far less expensive at 13.8. This is the case even though small cap value stocks are expected to experience earnings growth rates similar to large cap growth stocks over the next twelve months.
Performance has broadened across sectors as well. Ten of the eleven S&P 500 sectors have positive returns this year, with only the real estate sector slightly negative. Many sectors have year-to-date gains of 8% or more including financials, utilities, consumer discretionary, industrials, consumer staples, healthcare, and energy. While tech stocks have received most of the attention, and a few individual stocks have significantly outperformed the market, there are signs that other sectors are benefiting from the rally as well.
The bottom line? History shows that long-term investing isn’t just about “predicting winners” – it’s also about diversifying across styles, sectors, and more. Market leadership not only changes over time but also can do so swiftly. Staying diversified allows long-term investors to benefit from opportunities while also having a smoother ride as they work toward their financial goals.
Disclosure: This report was obtained from Clearnomics, an unaffiliated third-party. The information contained herein has been obtained from sources believed to be reliable, but is not necessarily complete and its accuracy cannot be guaranteed. No representation or warranty, express or implied, is made as to the fairness, accuracy, completeness, or correctness of the information and opinions contained herein. The views and the other information provided are subject to change without notice. All reports posted on or via www.aviorwealth.com or any affiliated websites, applications, or services are issued without regard to the specific investment objectives, financial situation, or particular needs of any specific recipient and are not to be construed as a solicitation or an offer to buy or sell any securities or related financial instruments. Past performance is not necessarily a guide to future results. Company fundamentals and earnings may be mentioned occasionally but should not be construed as a recommendation to buy, sell, or hold the company’s stock. Predictions, forecasts, and estimates for any and all markets should not be construed as recommendations to buy, sell, or hold any security--including mutual funds, futures contracts, and exchange traded funds, or any similar instruments. Please remember to contact Avior, in writing, if there are any changes in your personal/financial situation or investment objectives for the purpose of reviewing/evaluating/revising our previous recommendations and/or services, or if you want to impose, add, or modify any reasonable restrictions to our investment advisory services. Unless, and until, you notify us, in writing, to the contrary, we shall continue to provide services as we do currently. Please advise us if you have not been receiving account statements (at least quarterly) from the account custodian. A copy of our current written disclosure Brochure and Form CRS (Customer Relationship Summary) discussing our advisory services and fees continues to remain available upon request or at www.avior.com.


No Comments
Sorry, the comment form is closed at this time.